
Jewelry GMROI compares the gross profit earned during a defined period with the average inventory held at cost during that same period. It can help you inspect how much stock supported a result. It cannot tell you that a product will sell next month or that the business made a net profit.
Write the measure before collecting the numbers
The formula in Shopify's GMROI guide is gross profit divided by average inventory cost. Use a monetary gross-profit amount in the numerator, not a gross-margin percentage. Use inventory valued at cost in the denominator, not its possible retail selling value.
Name the date range, currency, category or variants, and cost basis. Keep returns and discounts consistent with the revenue measure you use. If the numerator covers all earrings but the denominator contains only one fastening type, the ratio will not describe either group properly.
Calculate one hypothetical period
Assume a fictional boutique analyzes a 90-day period in US dollars. Net merchandise sales are $2,400 and the cost of those sold goods is $1,500, using one consistent cost policy. Gross profit is therefore $900. These are invented teaching figures, not Rustic Jewel Co results.
Suppose four equally spaced inventory snapshots, measured on the same cost basis, are $500, $700, $600, and $600. Their simple average is ($500 + $700 + $600 + $600) ÷ 4 = $600. This is a stated snapshot estimate of average inventory, not a claim that stock stayed at $600 every day.
| Calculation | Result |
|---|---|
| Gross profit: $2,400 − $1,500 | $900 |
| Average inventory at cost: $2,400 ÷ 4 | $600 |
| Period GMROI: $900 ÷ $600 | 1.50 |
The interpretation is $1.50 of gross profit during those 90 days for each $1 of average inventory at cost under the stated snapshot method. It is not an annual ratio, a 150% net return, or a promise about the next period.
See what an endpoint average can hide
If you used only the beginning and ending snapshots, the average would be ($500 + $600) ÷ 2 = $550. The same gross profit would produce about 1.64. Nothing about sales improved; the denominator simply changed.
A major receipt midway through a period can make endpoint averaging less representative. When records permit, use more frequent consistent snapshots or a properly time-weighted balance, and document the method. Do not choose the method because it produces the higher ratio. If average inventory is zero or unsupported, report the measure as not calculable rather than substituting a convenient small number.
Check the source report's coverage
Shopify's profit-report documentation says products need cost recorded at the time of sale to appear in the relevant profit reporting. Missing cost data can make the reported sales cohort incomplete. Compare the included variants and net sales with the intended analysis before using the result.
Also check whether recorded item cost includes the same charges as inventory valuation. A supplier-price-only numerator and a freight-inclusive inventory denominator mix bases. Reconcile those differences rather than labeling both columns “cost” and assuming they match.
Keep adjacent metrics and product decisions separate
Faire's inventory-turnover explanation uses cost of goods sold over average inventory. That is a different numerator. Likewise, the markup and margin guide answers a price-versus-cost question, not the inventory-investment question here.
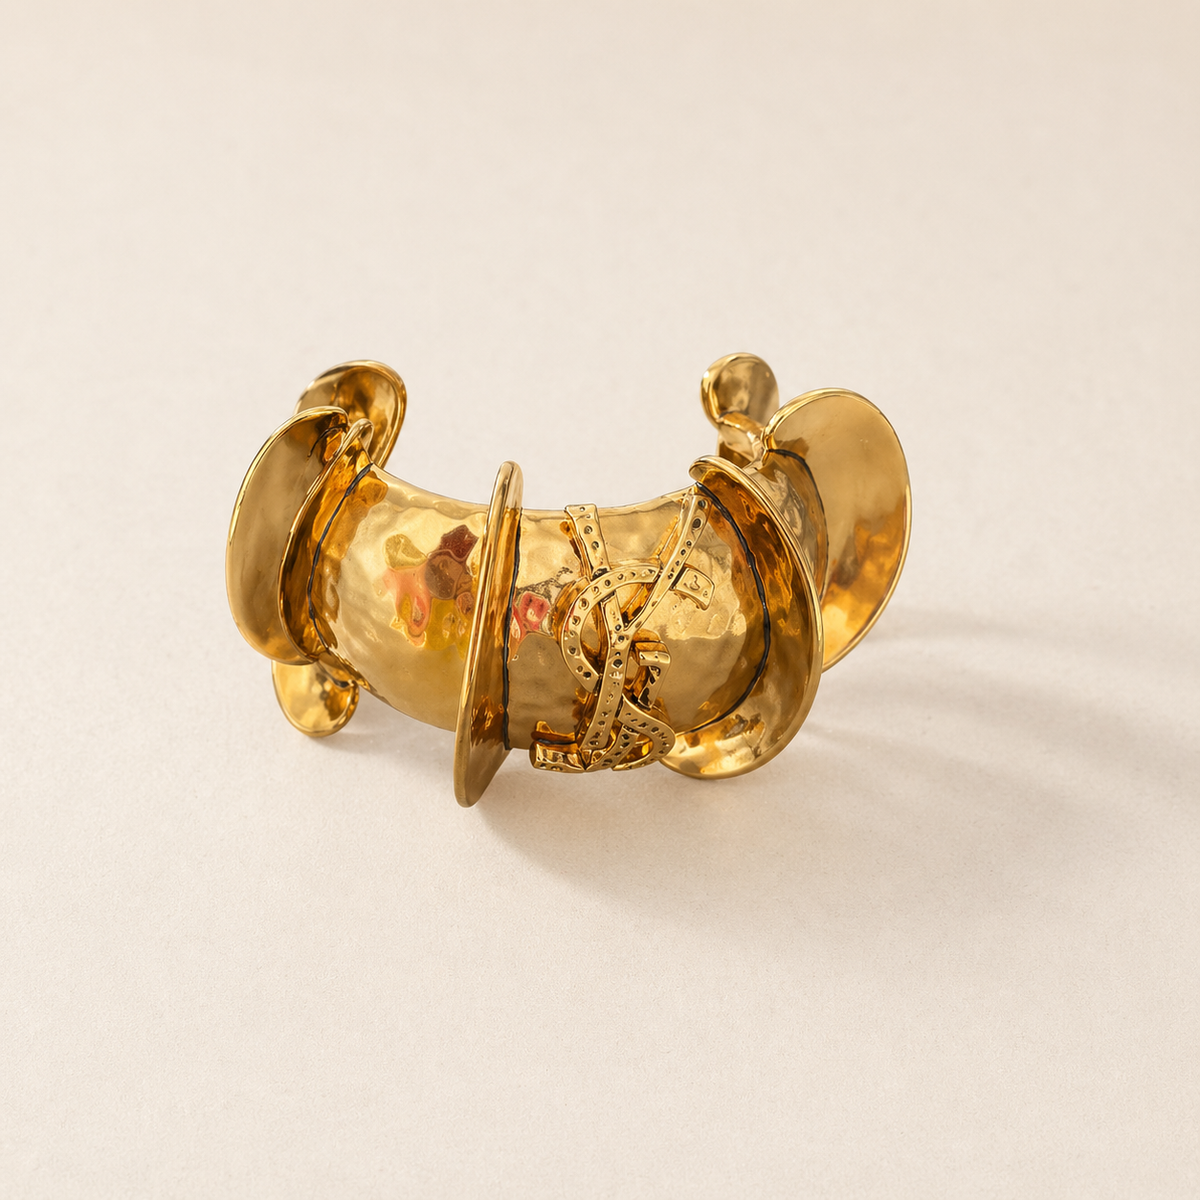
The sculptural gold-tone cuff provides a product example only. Appearance establishes neither a cost nor resale demand.

Review the ratio alongside exposure time, stockouts, reliable cost records, and the category's role. A number above one still leaves operating expenses outside gross profit. Use wholesale inquiries for current buying details, not an invented universal GMROI target.